
Turn passive website visitors into educated advocates
Transform your online presence from a passive information source into an interactive platform that drives engagement.
By integrating Polimapper’s interactive geographical visualisations into your site, you move beyond “national averages” and give every visitor a reason to care. Whether it’s a supporter looking up the situation in their area or an MP preparing for a debate, Polimapper turns your data into a localized story that demands action.
“Having it in the public domain adds value behind the scenes, helping inform and influence even without direct outreach.”
– Alzheimer’s Research UK

Supporting you throughout the user journey
Effective advocacy websites guide visitors through a four-stage journey of awareness, local relevance, education, and action. Polimapper’s web-integrated tools assist at every stage of the digital experience.
Awareness:
Capture attention immediately with high-impact heatmaps that visualise the national scale of your issue directly on your homepage.
Local relevance:
Allow visitors to enter their postcode to instantly see how your campaign affects their specific community, turning a global problem into a local priority.
Education:
Use interactive dashboards to break down complex datasets into easy-to-digest visual stories, helping visitors and policymakers alike understand the “why” behind the numbers.
Action:
Empower users to share their local findings through ‘email your MP’ supporter to action tools, backed by localised data so that every message matters.

How it works in practice
Say goodbye to overtly complicated dashboards
Start by uploading publicly available or internal data relevant to your campaign, or work directly with Polimapper’s data consultants to source the most impactful evidence.
Polimapper then translates this data into dashboards, heatmaps, and visualisations that are tailored to each individual constituency, local authority, health board or other administrative area.
Our team works with you to ensure every output aligns perfectly with your brand identity. We help you fine-tune the design to ensure your key message is the focal point of the visualisation.
Integrating the map into your website is effortless. Use our generator to create a custom embed code and add it to your page with a single click. Your visualisation becomes a native part of your site, guiding users through the data and straight to your call to action.
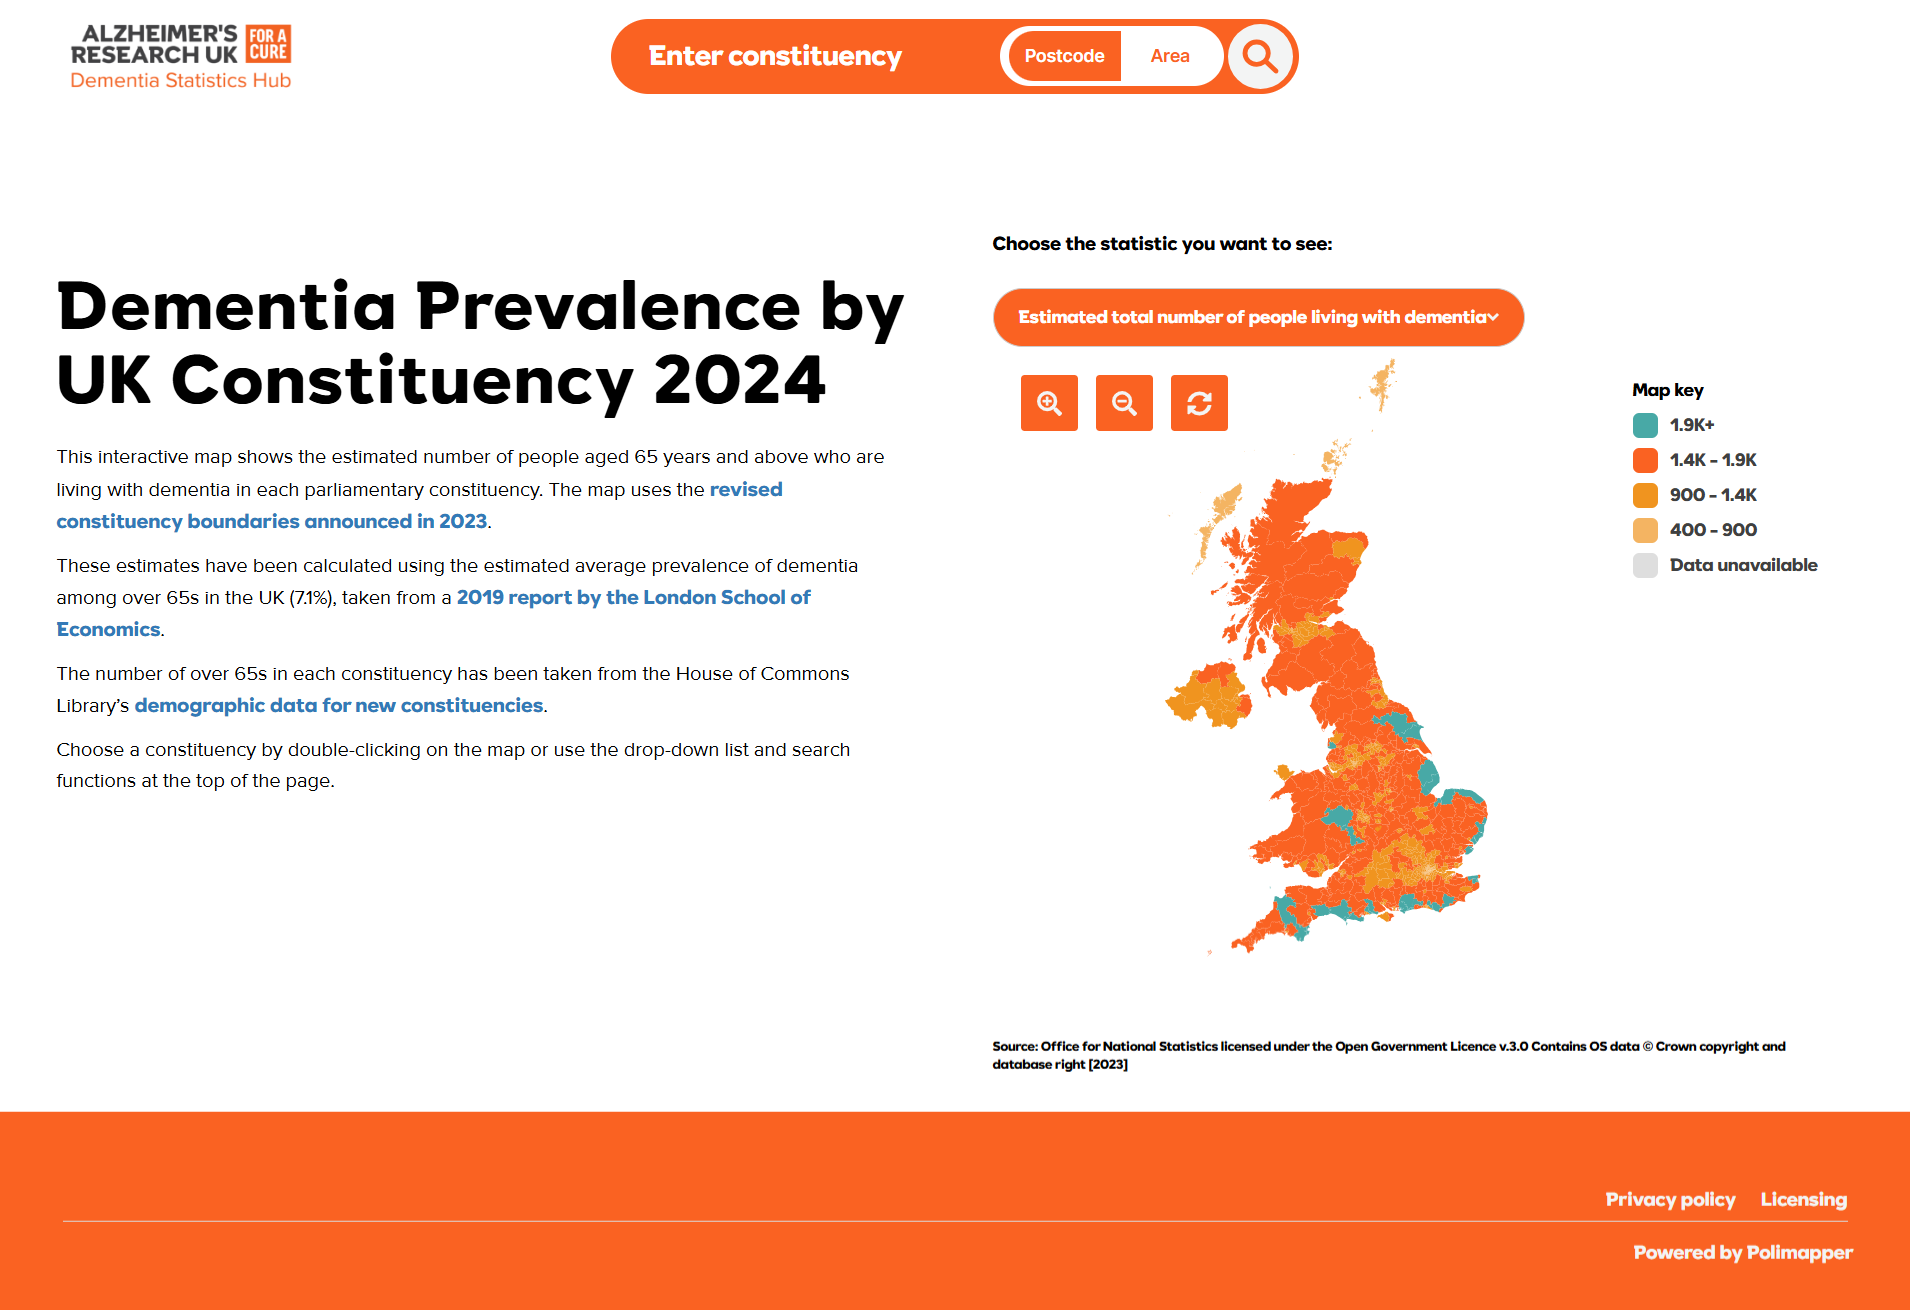
How Alzheimer’s Research UK’s constituency profiles powered MP speeches
Discover how Alzheimer’s Research UK used Polimapper’s platform to build a Dementia Statistics Hub. By making constituency-level data publicly available on their website, they empowered MPs to pull local stats for a Commons debate, directly influencing the parliamentary record.
Ready to elevate your website?
Our visualisations are a stress free solution to leveling up your website and getting stakeholders engaged from the first click:
- Design that looks and feels native to the site
- Full customisation
- Responsive across devices
Book a demo today, to see how Polimapper can turn raw data into persuasive narratives that win commitments.
