The Indices of Deprivation 2025 have been published, providing detailed insights into relative deprivation across neighbourhoods in England.
Commissioned by the Ministry of Housing, Communities and Local Government (MHCLG), the indices were produced by the Oxford Consultants for Social Inclusion (OCSI) and Deprivation.org. Their purpose is to quantify and measure the varying degrees of relative deprivation in small geographical areas across the country.
Consistent with the previous iteration, the Indices of Deprivation 2025 calculate deprivation across seven distinct domains, each made up of multiple indicators:
- Income deprivation (22.5%)
- Employment deprivation (22.5%)
- Education, skills and training deprivation (13.5%)
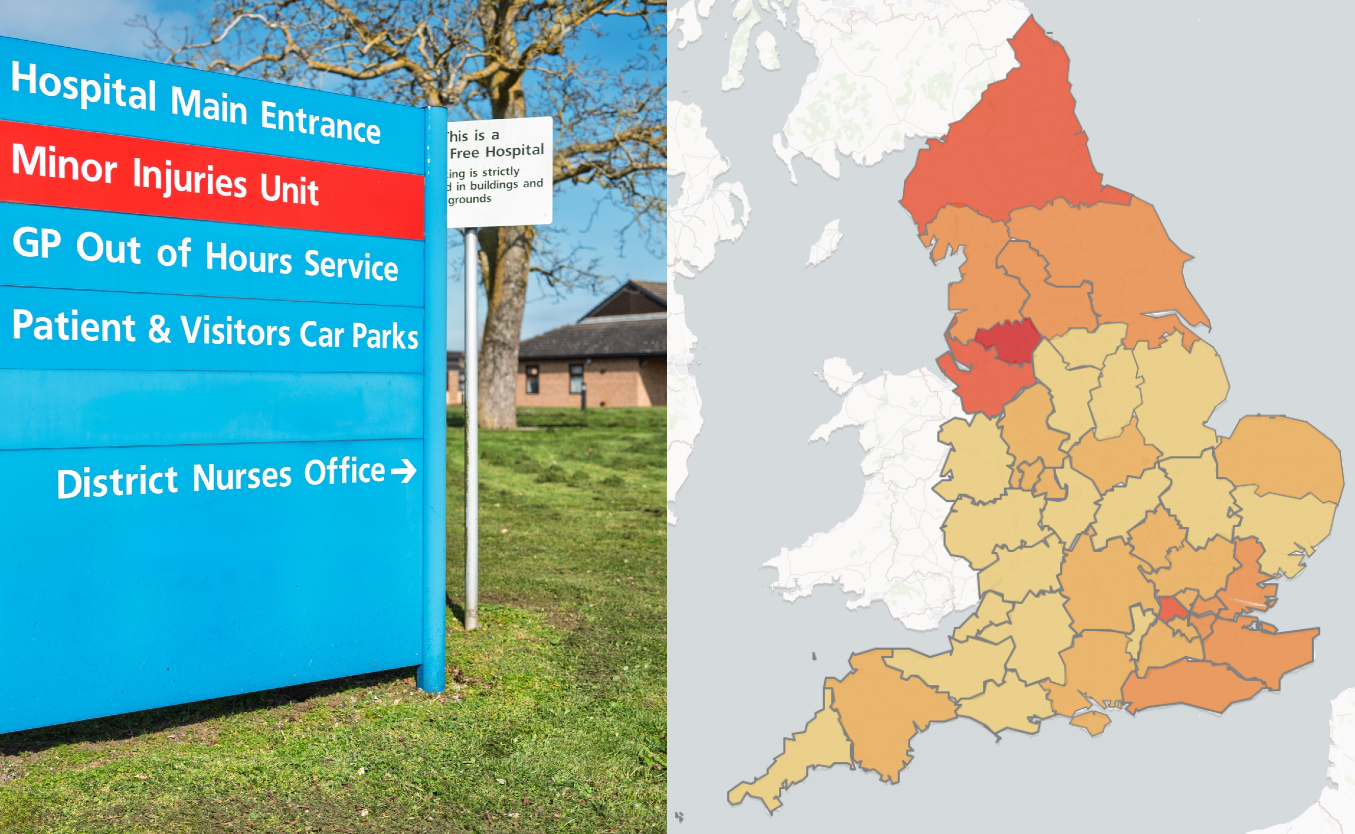
- Health deprivation and disability (13.5%)
- Crime (9.3%)
- Barriers to housing and services (9.3%)
- Living environment deprivation (9.3%)
These domains are weighted differently to produce the overall metric known as the Index of Multiple Deprivation (IMD).
Although the core framework of seven domains remains the same, the IMD 2025 methodology has evolved from the 2019 iteration. The new index was calculated using 55 indicators, a notable increase from the 39 used previously. Of these, 20 are entirely new, 14 have been substantially modified, and 21 have been updated to reflect more recent data.
Due to these methodological changes, the MHCLG advises caution when using the figures for a direct measurement of real change in deprivation over time. While limited overtime comparison of relative ranks can be made, the different methodologies mean that a change in rank does not necessarily equate to a true change in underlying conditions.
Learnings from the Indices of Deprivation in 2025
LSOA-level analysis
The Indices of Deprivation are measured at the Lower-layer Super Output Area (LSOA) level, a small statistical geography created by the Office for National Statistics (ONS). In England, there are a total of 33,755 LSOAs. These areas, often referred to as neighbourhoods, are designed to have a broadly similar population size, typically housing around 1,500 people.
The indices reveal the following trends at the LSOA level:
- The most deprived neighbourhood in England is located in Clacton-on-Sea, within the local authority of Tendring.
- Seven neighbourhoods in Blackpool rank amongst the top 10 most deprived in England.
- The remaining most deprived neighbourhoods are found in Hastings and Rotherham.
- The four least deprived neighbourhoods are all situated in St Albans, followed closely by areas in North Hertfordshire and Stockport.
Constituency-level analysis
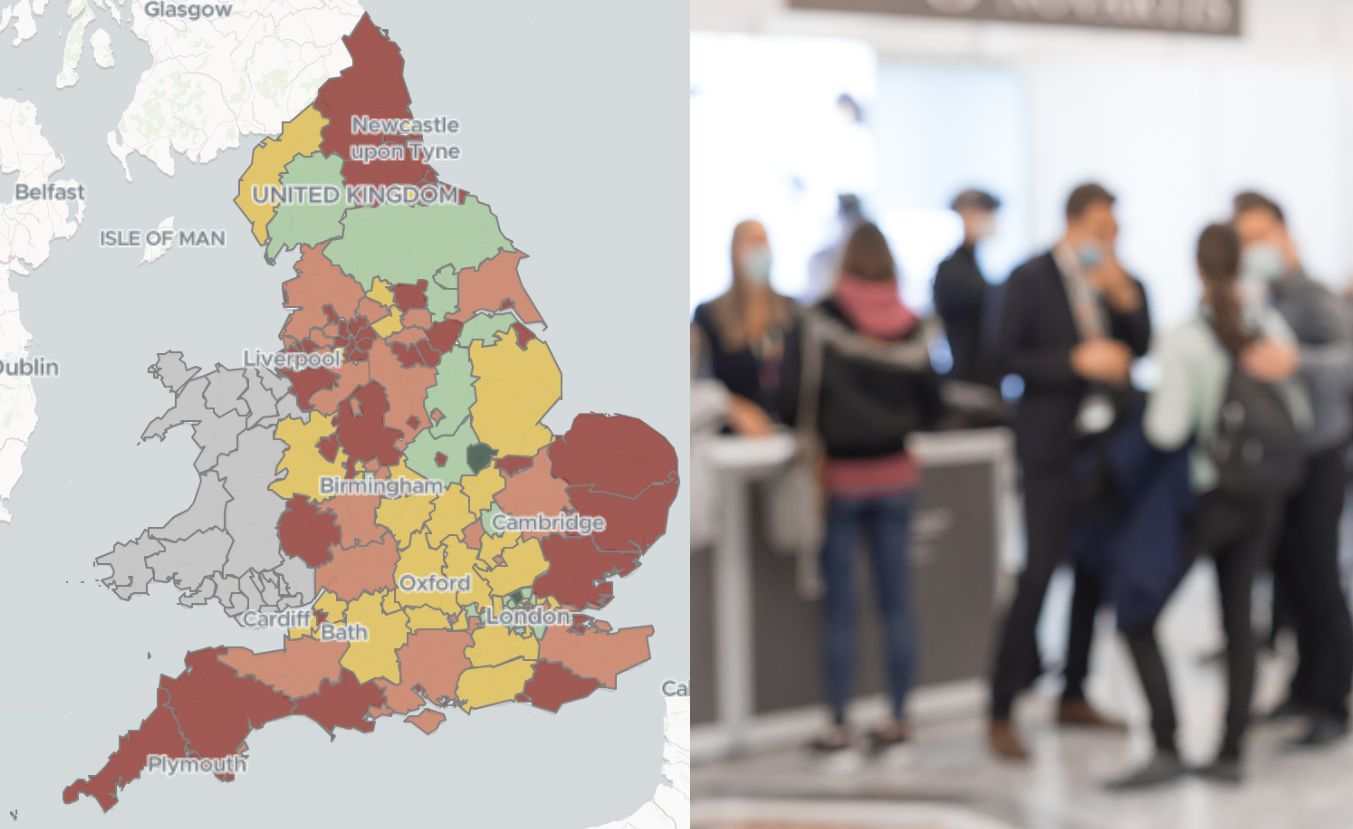
The Polimapper data team was the first to plot the deprivation figures to the constituency level, providing powerful insights for parliamentarians and policy-makers.
By assigning each LSOA to its respective constituency and averaging neighbourhood scores, a constituency-level Index of Multiple Deprivation measure was produced. This analysis was also applied to each of the seven domains.
The constituency insights show that, in England, nearly two thirds of parliamentary constituencies have at least one neighbourhood ranked in the most deprived decile. A total of 15 constituencies recorded the highest average IMD values:
- Birmingham Erdington
- Birmingham Hodge Hill and Solihull North
- Birmingham Ladywood
- Birmingham Perry Barr
- Birmingham Yardley
- Blackpool South
- Bolton South and Walkden
- Bradford East
- Bradford West
- East Ham
- Liverpool Walton
- Sheffield Brightside and Hillsborough
- Tottenham
- Walsall and Bloxwich
- Wolverhampton South East
At the opposite end of the spectrum, 75% of constituencies contain at least one of the least deprived neighbourhoods nationally. Chesham and Amersham, and Maidenhead are among the 14 least deprived areas overall.

A comparison of the most and least deprived constituencies – using Birmingham Erdington and Oxford West and Abingdon as examples – illustrates the diverse factors driving the overall IMD score.
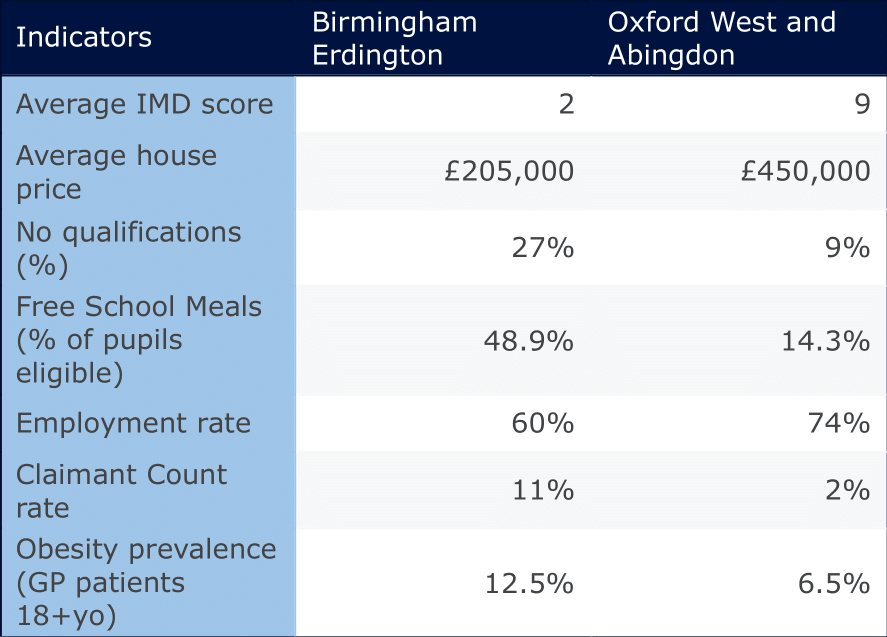
Birmingham Erdington, one of the lowest-scoring constituencies overall, faces unfavourable economic and health conditions, underscored by a high obesity rate of 13% and a low employment rate of 60%.
Oxford West and Abingdon, a constituency ranked among the least deprived, sees favourable figures across health, income, education and employment. In this area, employment rates are significantly higher than that of Birmingham Erdington, while both the rate of people with no qualifications and obesity prevalence are lower.
Nonetheless, the biggest divide is seen in free school meals eligibility, revealing stark trends in child poverty. Indices data shows that 73 neighbourhoods in England had nearly 100% of children living in income-deprived families, compared to zero neighbourhoods in 2019.
Indices of Deprivation visualised
The data team at Polimapper has visualised IMD insights at the constituency level.
To explore statistics in your area double click on the map or use the search bar. Alternatively, click here to launch the full page visualisation.
IMD 2025 and IMD 2019: Analysing changes in relative deprivation
While IMD figures primarily reflect a shift in relative rank rather than a change in conditions over time, a set of comparisons can still be drawn between the 2019 dataset and the most recent one.
At the neighbourhood level, the data shows that 18% of neighbourhoods now in the most deprived decile were not ranked as such in 2019. Conversely, another 592 LSOAs moved out of the most deprived decile to the second and third most deprived.
By plotting 2019 Index of Multiple Deprivation data to the most recent constituency boundaries, we were able to draw further comparisons between this year’s and the previous iteration.
The analysis reveals a decrease in the number of constituencies classified as ‘most deprived’ from 21 in 2019 to 15 in 2025. Only two constituencies, Tottenham and East Ham, have newly joined the most deprived group.
At the other end of the scale, only the constituency of Oxford West and Abingdon has moved to become one of the least deprived areas.
Additionally, the data also shows that 73 constituencies are now considered less deprived, having improved their rank, while 80 constituencies are considered more deprived. The net result is that more constituencies have experienced a decline in their relative position across the IMD rankings than those that have seen an improvement.
The IMD as a tool
The new index offers a deeper, more detailed perspective on deprivation across England. By employing a richer set of indicators, it successfully highlights areas of acute need – from specific LSOAs in places like Clacton-on-Sea to concentrated clusters of constituencies nationwide. This comprehensive data provides a granular view of how multiple forms of deprivation intersect, revealing the complexity of challenges faced by various communities and underscoring the urgent need for targeted efforts.
Ultimately, the deprivation index is an essential strategic tool, not just a statistical exercise. It serves as a vital resource for government and local leaders to inform policy and develop targeted, evidence-based interventions precisely where they are needed most. The insights can also be leveraged to support organisational efforts in shining a light on the most pressing issues leading to deprivation.