Welcome to the latest edition of Public Data Insights, our monthly summary of the latest data and statistical releases from various government departments and public bodies, all with a focus on sub-national insights.
With a wealth of statistics available from government sources, there are many opportunities to leverage this data to communicate key issues to stakeholders at a local level.
Whether you’re tracking local government finance, health profiles or more specialised data releases, this round-up is designed to spotlight some of the most intriguing regional and local-level statistics.
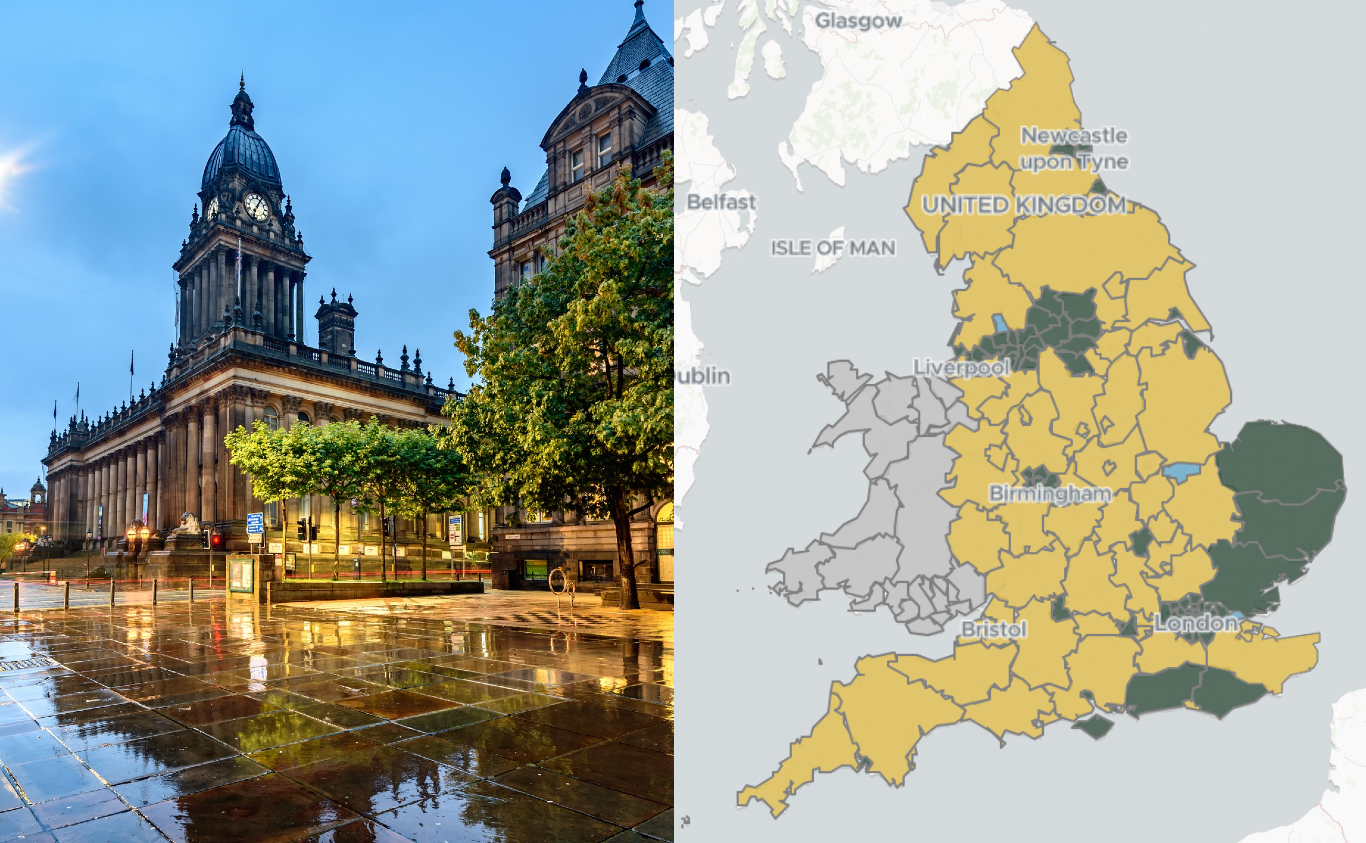
Council tax statistics
Band D council tax in England for the financial year 2025-26 will increase by 5% from the previous year, data from the Ministry of Housing, Communities & Local Government shows.
In the new financial year, the average Band D council tax across the country will be £2,280. Additionally, the council tax requirement will be of £44.1 billion, of which £654 million will be raised through the adult social care precept flexibility and £859 million through parish precepts.
The local authorities of Rutland, Gateshead and Northumberland register the highest average Band D council tax, at over £2,200, inclusive of adult social care and parish precepts. Conversely, London areas, including Wandsworth (£507) and Westminster (£529), will see the lowest band D council tax charges on average.
View our Council Tax visualisation: Council tax requirements and charges 2025/2026
Next update: TBA
Source: Ministry of Housing, Communities and Local Government
School capacity
In 2023/2024 there were just over 9 million state-funded school places in England. The rate of school places added has slowed in recent years, particularly in primary schools, due a reduction in pupil numbers since 2018/19.
16% of primary schools were at or over capacity in the last academic year, this was down by 1% from the year before. Additionally, 24% of secondary schools were at or over capacity in 2023/2024.
Coventry registered the highest percentage of schools at or in excess of capacity in England, at 58.9%. This was followed by Sutton (44.6%). Conversely, in Hartlepool, Waltham Forest and Newham, over 95% of schools had one or more unfilled places.
Next update: Updated yearly
Source: Department for Education
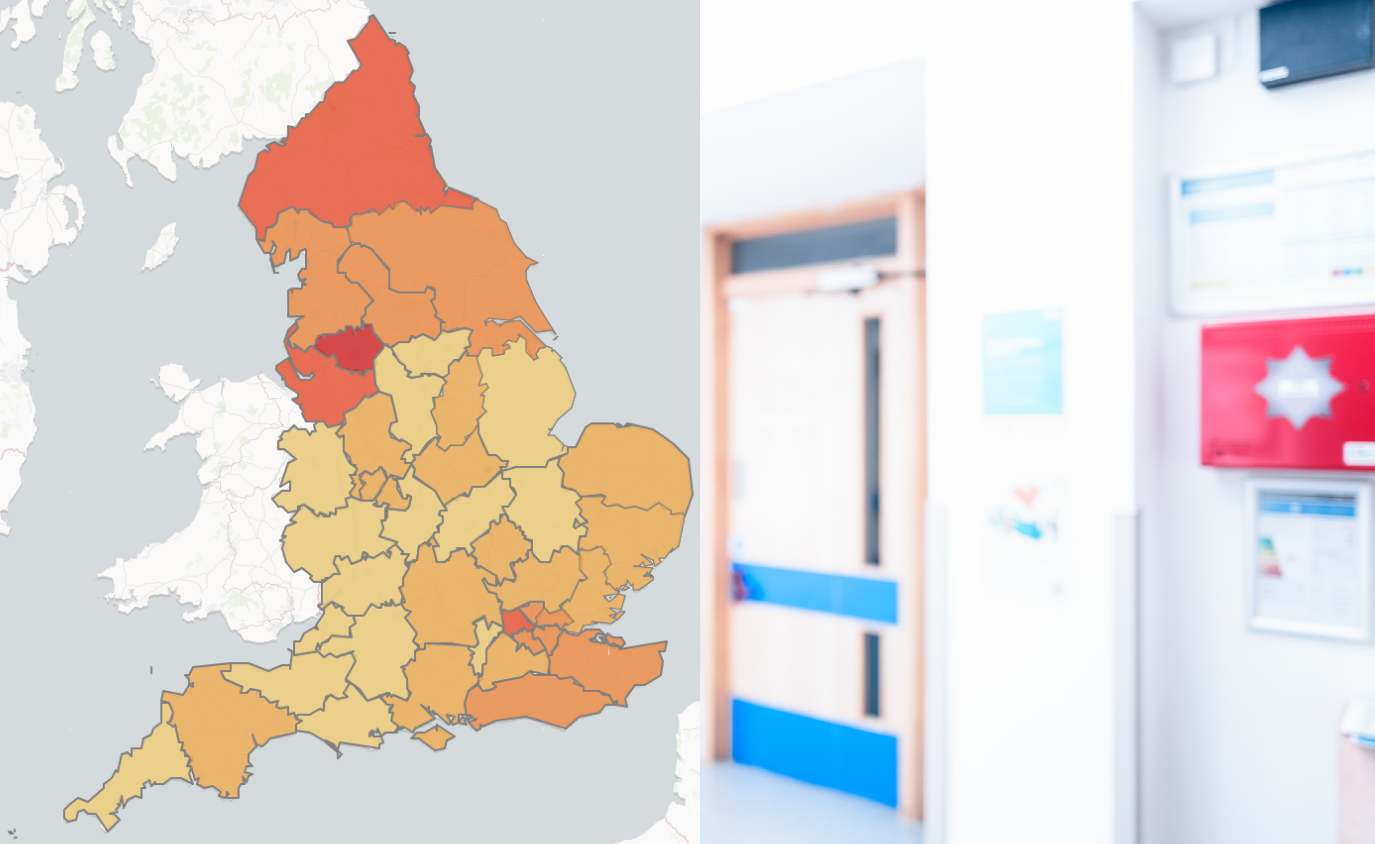
Fuel Poverty in England
In 2024, there were an estimated 2.73 million households in fuel poverty in England. This is a rate of 11%, according to the Low Income Low Energy Efficiency metric.
The data from the Department for Energy Security & Net Zero has revealed that, although high, the number of households in fuel poverty has slightly decreased from the previous year.
The region which saw the highest rate of fuel poverty in 2024 was the West Midlands, at 16.4%. Yorkshire and the Humber followed (14.2%). In the East of England, London and the South East regions this was below 10%.
According to projections, in 2025, fuel poverty will increase slightly to 11.2%.
Next update: TBA
Source: Department for Energy Security and Net Zero
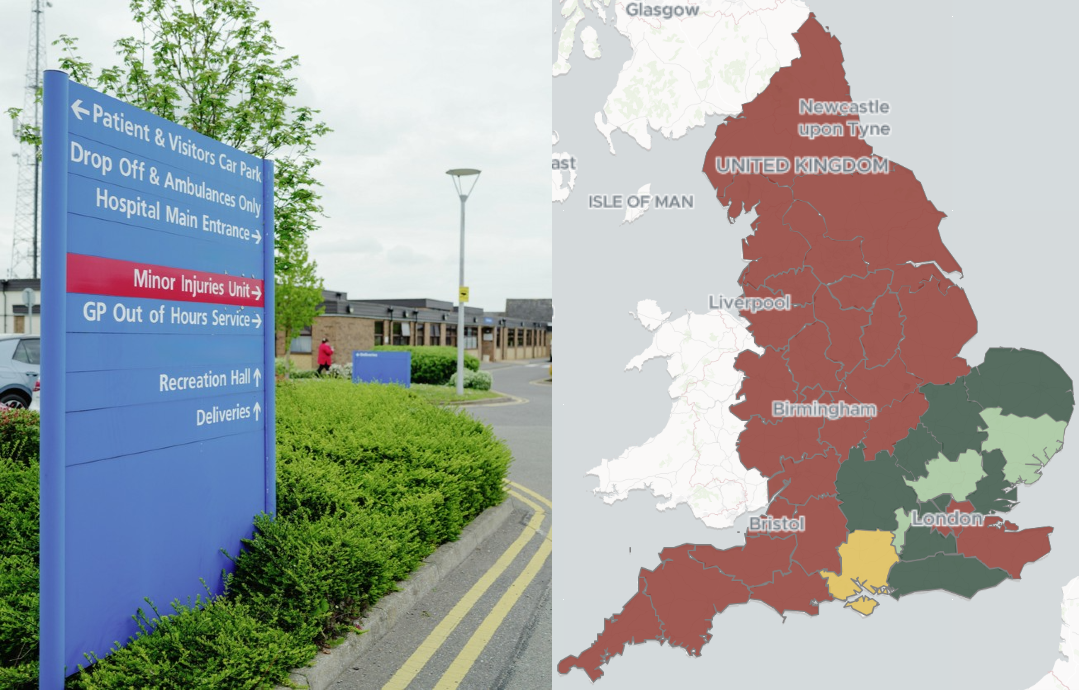
Access to sexual health services
The rate of young men and women who use sexual health services increased throughout 2023, after a drop during the pandemic. Nonetheless, access to these services remains below pre-pandemic levels.
Data from the Office for Health Improvement & Disparities shows that the attendance rate for women under 25 at sexual health services was 103 per 1,000 in 2023. This is a decrease from 133 per 1,000 in 2019. For men, the numbers are significantly lower, at 14.2 per 1,000 in the most recent year.
Attendance rates vary significantly on a regional level. Numbers are highest in the North West (134) and lowest in the West Midlands (56).
View our Sexual Health visualisation: Sexual Health Statistics
Next update: TBA
Source: Office for Health Improvement & Disparities
Modern Slavery referrals
The quarter ending December 2024 saw the highest numbers of referrals for modern slavery since the National Referral Mechanism (NRM) began in 2009.
The Home Office reports that between October and December 2024, 5,540 potential victims of modern slavery were referred under the NRM. This is an increase of 17% from the previous quarter and of 34% from the previous year.
The most common nationalities amongst those referred were British, at 20%, Eritrean and Albanian, both at 11%.
The Metropolitan Police Service, for Greater London, saw the highest number of reports in the UK, at 1,466 throughout the last quarter of 2024. This was followed by Kent Police at 848 reports and West Midlands Police, with 337 reports taking place in the West Midlands region.
There have been a number of changes which have collectively raised the profile for modern slavery since 2014, increasing awareness and, potentially, overall referrals. Nonetheless, the Home Office reports that it is not possible to point to a main driver to this issue.
Next update: TBA
Source: Home Office