The UK Claimant Count rose in January 2025, hitting 1.750 million amid a continuing decline in job vacancies. The estimated number of vacancies, dropped by 9,000 to 819,000 in the quarter from November 2024 to January 2025. Although vacancies have fallen for 31 consecutive quarters, they still remain higher than pre-pandemic levels.
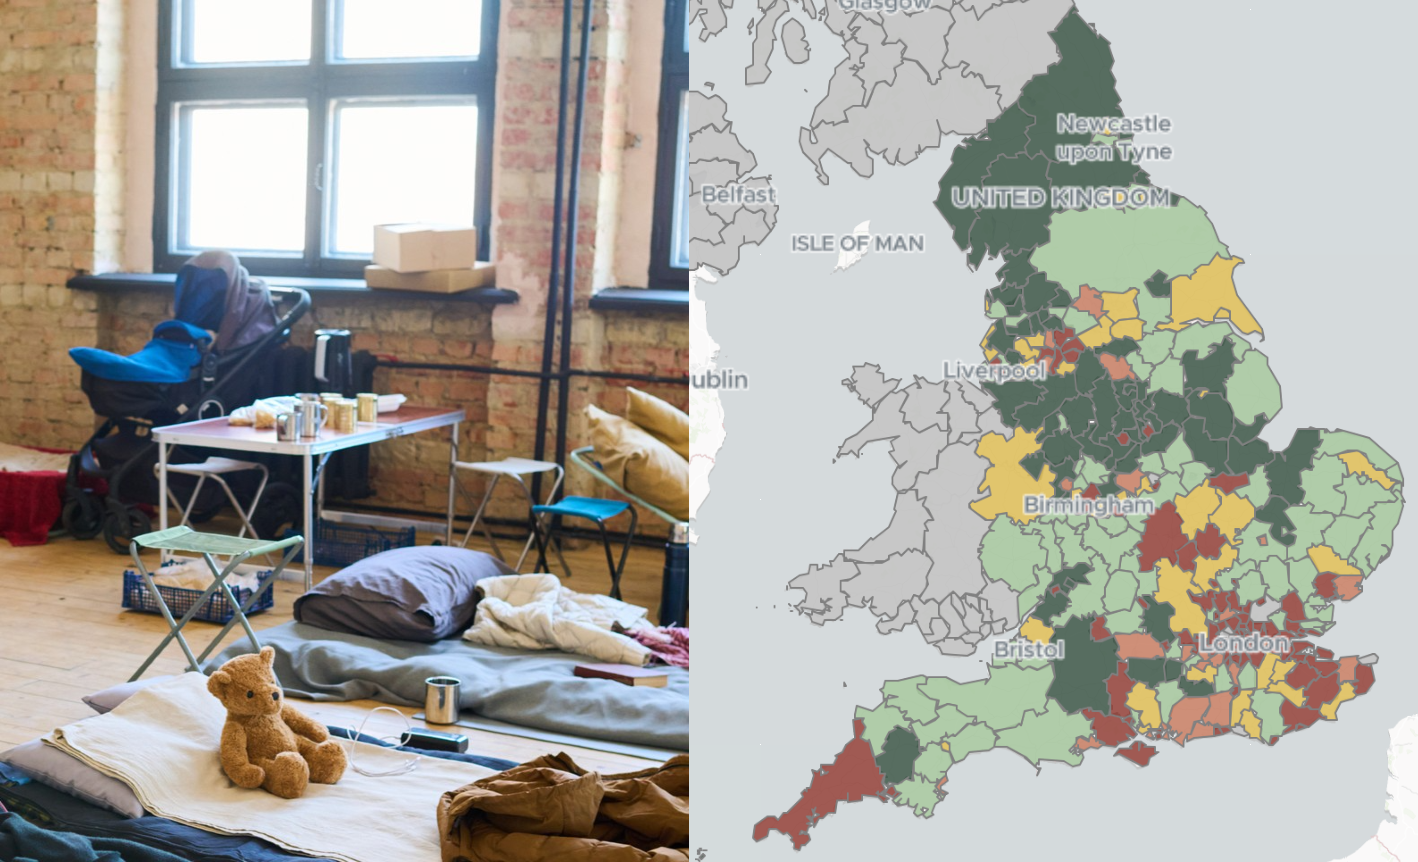
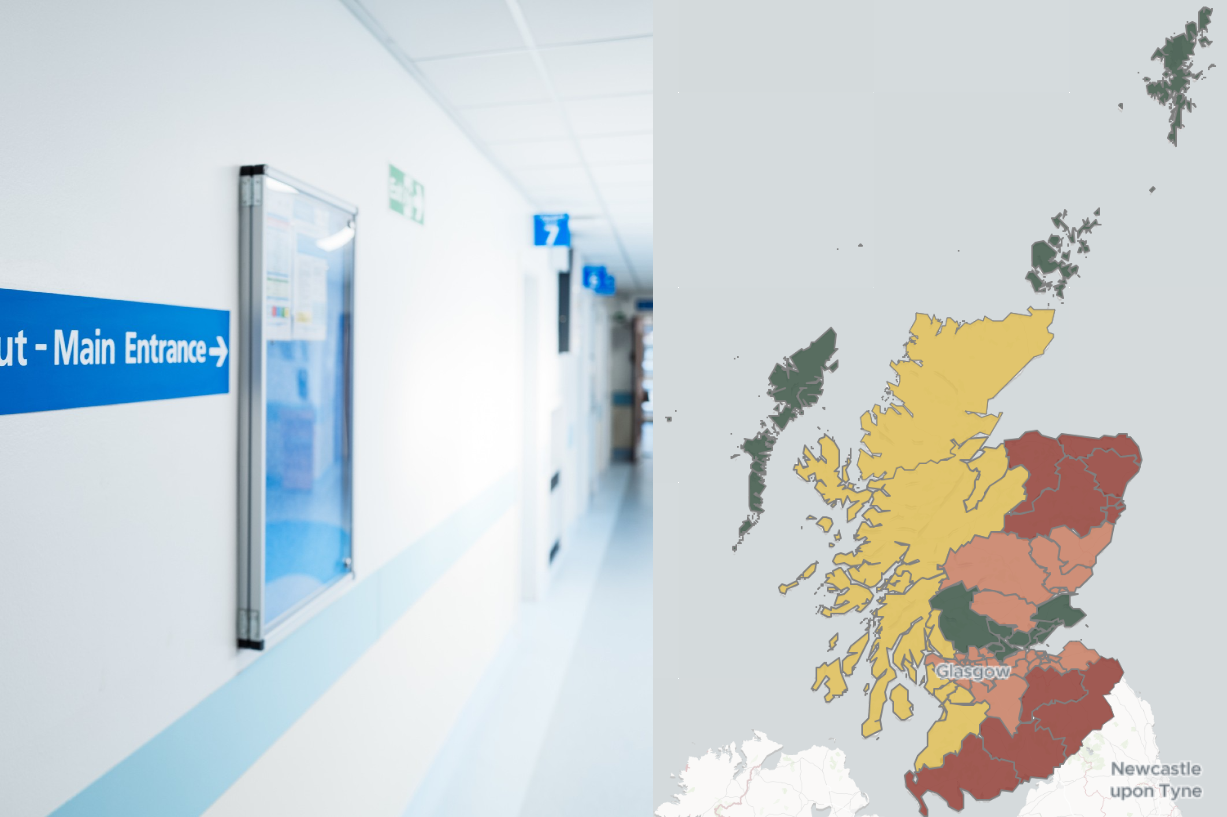
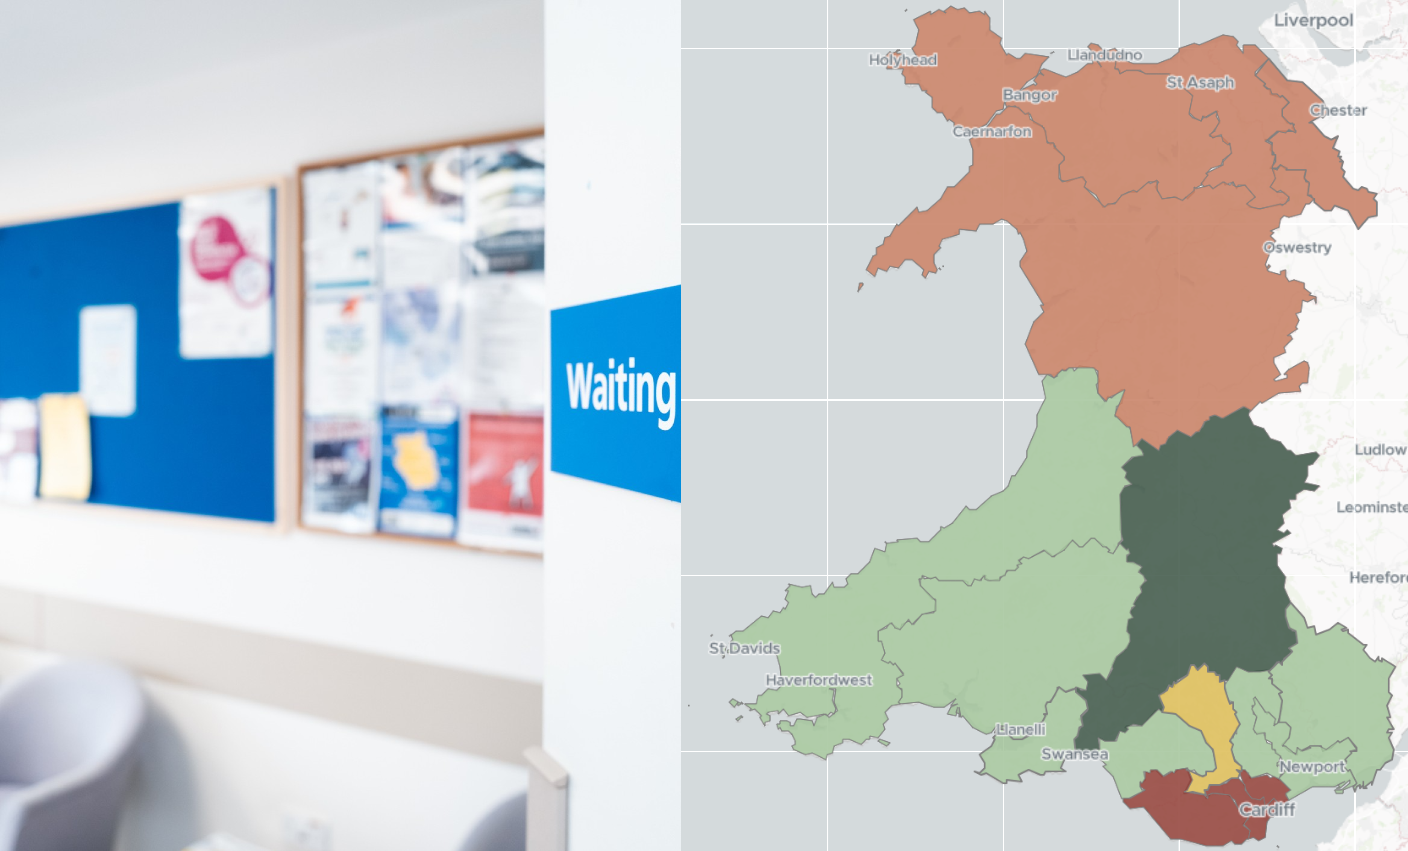
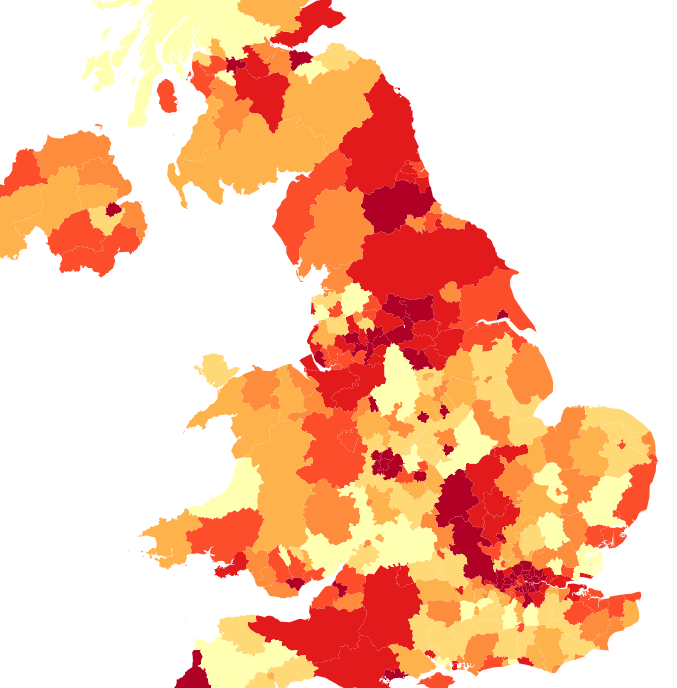
Regionally, the picture is varied. Areas like Newham experienced the largest percentage increase in claimants (1.4%). Conversely, Belfast saw the most significant percentage decrease in claimants (-0.1%). Birmingham has the highest proportion of its population claiming benefits (10.7%), while Rutland has the lowest proportion of claimants (1.8%).
Across the regions, the data suggests that changes in the claimant count have affected men and women very similarly. While there are minor variations in the percentage changes between genders in some areas, these differences are generally small and likely not statistically significant.
About this map
The map below highlights the UK Claimant Count by region, using data from the Office for National Statistics (ONS). To explore detailed figures for your area, double-click on the map or click here to view the full-page version.