According to the Department for Environment, Food and Rural Affairs (Defra), properties in ‘predominantly rural’ areas in England cost on average £7,000 less than those in ‘predominantly urban’ areas.
In England, house prices average at £323,471 per house. The local authority which registered the highest average price across the board was Kensington and Chelsea at £1,193,500 per house, followed by Westminster (£910,700), Richmond Upon Thames (£745,900), Hammersmith and Fulham (£720,100), and Camden (£679,700). Conversely, the local authorities of Burnley, Hyndburn, Pendle, and Hartlepool, are where house prices are lower on average. In these areas, a house costs less than £130,000 on average.
When analysing the data by type of property, detached properties are the most expensive ones, with an average cost across England of over £570,000 per property. This is almost triple the price of flats and maisonettes in the country, which cost on average £193,398 per property. Of all areas which register both lower and higher house prices amongst all categories, most are ‘predominantly urban’. However, ‘predominantly rural’ areas should also be accounted for. Rural areas located in the proximity of London and in the South East and South West regions of England tend to be more expensive. For example, Waverley, in Surrey, has an average property price of over £500,000.
Rural areas located in the North West and North East tend to register lower property prices. This is the case of County Durham, with properties costing on average £130,400 in the area. This way, rural and urban categorisations do not automatically translate into trends in property prices in England as this tends to link with location based factors rather than with urban-rural classifications.
About this map
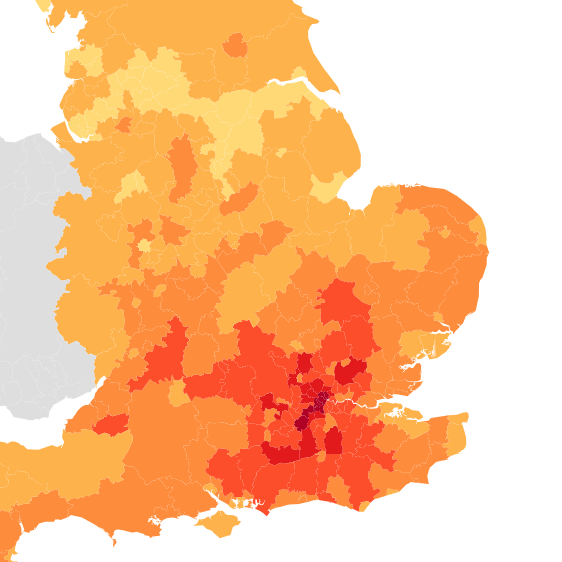
The map below was created using our ‘Local Authority Districts 2023’ template, with data from the Department for Environment, Food and Rural Affairs (DEFRA). The visualisation maps statistics on property prices in England as of December 2024. This is categorised by property type: detached properties, semi-detached properties, terraced properties, and flats and maisonettes.
To learn more about the situation in your area, double click on the map below.
Alternatively, click here to launch the full page version.