January saw the release of new census data relating to health, disability, and unpaid care in local authorities across England and Wales. Using Age-Standardised proportions, we have taken a deep dive into the data to learn more about the state of health in 2021.
General Health
For questions regarding health in the 2021 Census, respondents were asked to assess their general health on a five point scale: “Very good”, “Good”, “Fair”, “Bad”, and “Very bad”.
Overall, general health in England and Wales has improved in the last ten years since the 2011 census. The proportion of those reporting “Very good” health in England increased from 45% to 47.5%. Wales reported a 0.9% increase in those reporting “Very good” health, whilst both countries saw decreases in the proportion of people answering “Fair”, “Bad”, and “Very bad” health.
In England, 27.4 million people reported “Very good” health and 19 million reported “Good” health. 13% of the population reported their health as “Fair”, whilst 4.1% reported “Bad”. The number of respondents who reported “Very bad” health increased by 2,000 from 2011, but the overall proportion of people had decreased by 0.2% to 1.2% in 2021.
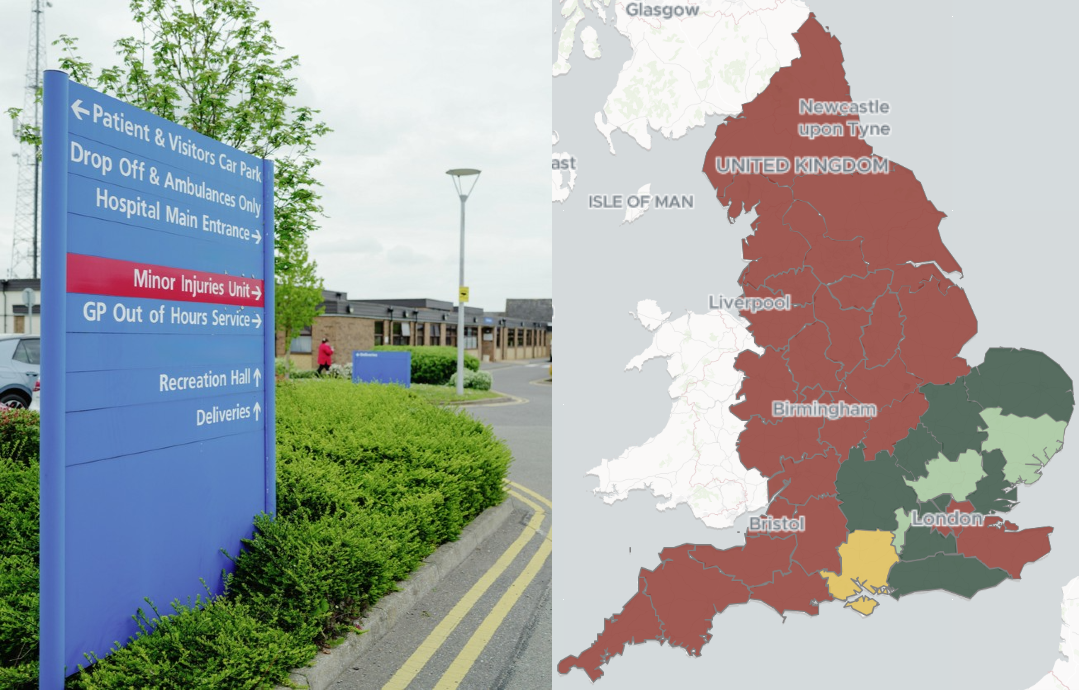
The region with the highest proportion of people reporting “Very good” health was the South East (49.6%). The North East, however, had the highest proportion of people reporting “Very bad” health (1.6%). This had dropped from 1.8% in 2011, indicating that health is improving in the North East.
The local authorities with the highest proportion of respondents reporting “Very good” health were Kensington and Chelsea (58.0%), Elmbridge (57.7%), and Richmond-upon-Thames (57.6%). Stoke-on-Trent reported the lowest proportion with 40.2%.
Tower Hamlets in London reported the highest proportion of people with “Very bad” (2.5%) and “Bad” health (7%).
Whilst overall in England health improved, five local authorities saw an increase in “Very bad” health; Calderdale (1.3%), Mid Devon (1%), South Cambridgeshire (0.8%), Guildford (0.8%) and the Isles of Scilly (0.8%).
In Wales, 1.4 million people reported “Very good” health and 1 million reported “Good” health (32.5%). The proportion of those reporting “Fair” and “Bad” health both decreased by 0.9% points falling to 14.1% and 5.1% respectively. 52,000 people reported “Very bad” health, down from 55,000 in 2011.
Gwynedd and the Isle of Anglesey reported the highest proportion of their populations reporting “Very good” health (51.5% and 50.7% respectively). Merthyr Tydfil reported the highest proportion of people with “Very bad” health (2.4%). This area, however, saw the greatest decrease in “Very bad” health (0.7% decrease, from 3.1% in 2011) and the greatest increase in “Very good” (up to 44.6% from 42.1%). Denbighshire with an increase of 0.1%, was the only Welsh local authority which saw an increase in “Very bad” health.
The impact of Covid-19
The census took place on the 21st March 2021, when the UK was in its third national lockdown. The impact of the Covid-19 pandemic in relation to both people’s actual health, and their perception of their own health is unknown. For those whose health was not impacted by the pandemic, or had potentially recovered from Covid by the time of the census, may have perceived their health as better than they did pre-pandemic, resulting in a higher proportion of people reporting “Very good” health. The overall impact of this is, at this moment, unknown, but worth keeping in mind when reviewing census health data.
Disability
The question relating to disability was updated for the 2021 census. In 2011, respondents were asked “Are your day-to-day activities limited because of a health problem or disability which has lasted, or expected to last, at least 12 months?”.
However, in order to align more closely to the definition of disability in the Equality Act (2010), the 2021 census asked “Do you have any physical or mental health conditions or illnesses lasting or expected to last 12 months or more?”. Respondents who answered “Yes” were then asked “Do any of your conditions or illnesses reduce your ability to carry out day-to-day activities?”.
Under the Equality Act (2010) you are disabled if “you have a physical or mental impairment that has a ‘substantial’ and ‘long-term’ negative effect on your ability to do normal daily activities”. The change in how disability is identified may have impacted the number of people who identified as disabled in 2021 compare to 2011.
Across England and Wales, the proportion of disabled people decreased 1.7% to 10.4 million, or 17.8%, of the population.
In England, the proportion of disabled people decreased from 2011, but the number of people with a disability increased from 9.4 to 9.8 million. The North East (21.2%) and the North West (19.8%) were the two regions with the highest proportion of disabled people. London (15.7%) and the South East (16.1%) had the lowest proportions of disabled people.
Blackpool (24.7%) and Liverpool (23.8%) were the two local authorities in England which reported the highest proportion of disabled people, at 7% and 6.1% above the national estimate respectively. The City of London (11.8%) and Elmbridge (12.2%) were the two English local authorities with the lowest proportion of disabled people.
Click here for visualisation
Despite having the lowest proportion of disabled people regionally, the top four local authorities which saw the largest increases in the proportion of disabled people in the last ten years were all in the South East. The top five local authorities which saw the largest decrease in the proportion of disabled people were in London, with Tower Hamlets reporting the largest decrease.
In Wales, the proportion of the people who were disabled decreased from 23.4% to 21.1%, down to 670,000 people.
Neath Port Talbot (24.6%), Blaenau Gwent (24.6%), and Merthyr Tydfil (24.2%) reported the highest proportion of disabled people in both 2011 and 2021. All three authorities did also, however, see the largest decreases in the proportion of disabled people compared with 2011.
Monmouthshire (17.7%), Gwynedd (18.1%), and Powys (18.1%) were the three Welsh constituencies reporting the lowest proportion of disabled people.
Unpaid Care
Similarly to the question regarding disability, questions surrounding unpaid care were also updated in the 2021 census. The census previously asked people in England and Wales “Do you look after, or give any help or support to family members, friends, neighbours or others?”.
In 2021, the question differed, and people were asked “Do you look after, or give any help or support to, anyone because they have long-term physical or mental health conditions or illness, or problems related to old age?”. Any care work that people did as part of their paid employment was excluded.
The question in 2021 had six possible answers to select.
- “No”
- “Yes – 9 hours of less of unpaid care a week”
- “Yes – 10-19 hours of unpaid care a week”
- “Yes – 20-23 hours of unpaid care a week”
- “Yes – 35-49 hours of unpaid care a week”
- “Yes – 50 or more hours of unpaid care a week”
Five million people in England and Wales aged 5 years and over selected “Yes”. In both England and Wales, unpaid carers most commonly provided “50 or more hours of unpaid care a week” (1.4 million in England, 107,000 in Wales).
Click here for visualisation
The second most selected category in both countries was “9 hours or less” with 1.7 million unpaid carers providing this in England, and 96,000 in Wales.
In England, the five local authorities with the largest proportions of residents who provided unpaid care were St. Helens (11.7%), Ashfield (11.6%), Mansfield (11.5%), Knowsley (11.5%) and Halton (11.3%). The City of London reported the smallest proportion of people over the age of 5 providing unpaid care (6.3%).
In Wales, Neath Port Talbot (12.3%), Caerphilly (11.4%), Torfaen (11.4%), Blaenau Gwent (11.3%), and Merthyr Tydfil (11.3%) reported the highest proportion of usual residents who provided any amount of unpaid care. The Welsh local authority with the lowest proportion of unpaid carers was Gwynedd (1.7%),
The impact of Covid-19
The changes reported since 2011 may be explained by the Covid-19 pandemic. The census took place during a national lockdown where household mixing was restricted. Restrictions on travel and household visits may have reduced unpaid care opportunities. Rules of household mixing may have also resulted in some unpaid carers who previously shared caring responsibilities increasing their hours. In addition, coronavirus resulted in a higher number of deaths than usual for a given year amongst the older population. This may have reduced the number of people who needed care, and thus reducing the number of unpaid carers.