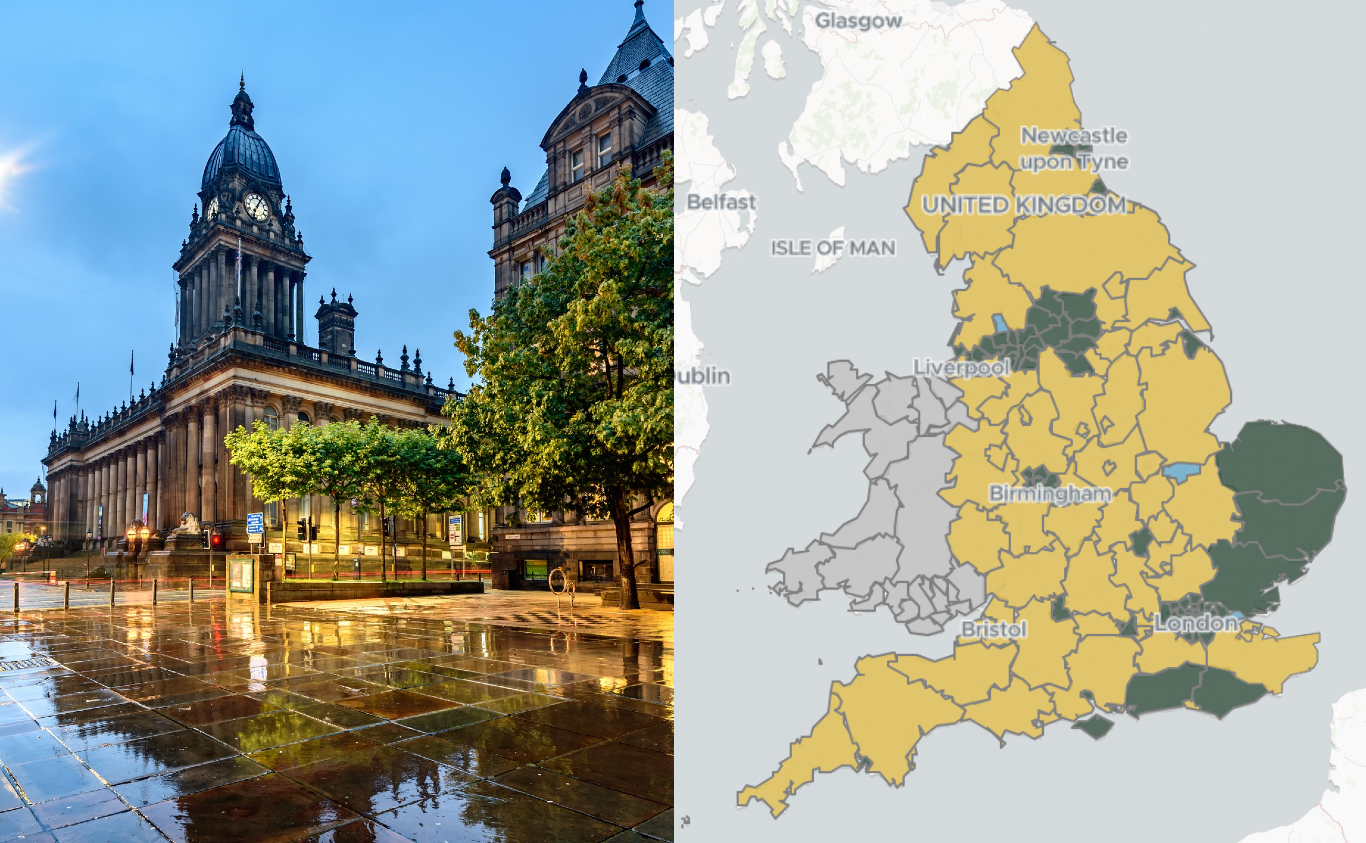
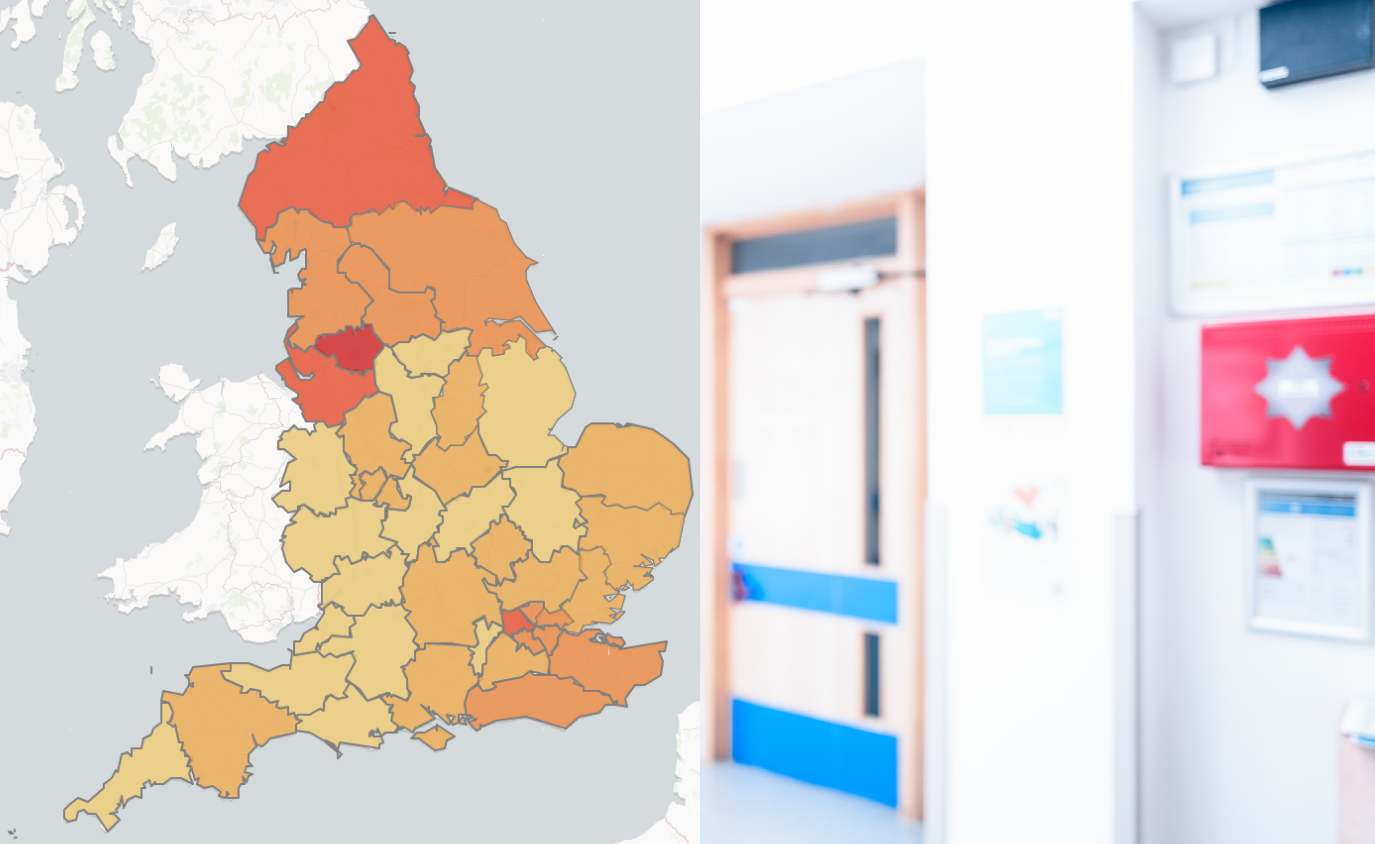
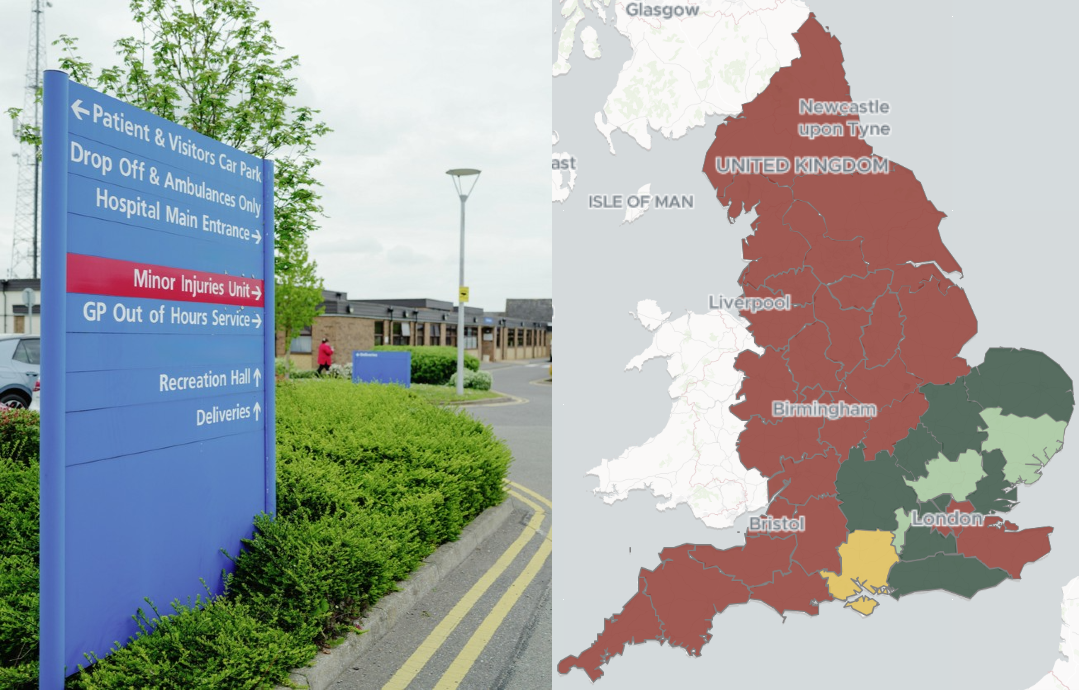
With the release of fuel poverty data by the government, we have visualised the way in which it is distributed across the country by parliamentary constituency.
The report from the Department of Business, Energy and Industrial Strategy found only a marginal decrease in the number of households living in fuel poverty from the year before.
Despite improvements in the three key factors determining fuel poverty (energy efficiency, income, and energy prices) the number of households in fuel poverty only decreased from 13.4% to 13.2%.
We have used the current 2019 data to visualise the rates of fuel poverty in each of England’s parliamentary constituencies. The next set of statistics, using data from 2020, will be released in April.
Find out more about the percentage of households in fuel poverty in your local area, and how this compares to the rest of the UK. Click here or on the image below to use the tool: